Machine Learning for Stock Market Analysis: From Data Pipeline to Backtesting
Traditional technical analysis relies heavily on visual chart interpretation. Over the long term, however, manually searching for patterns in financial markets is affected by human bias and the limits of individual perception. As part of our R&D work, we developed a proprietary machine-learning system for stock market analysis to explore a practical question: can meaningful signals be extracted consistently from market noise?
Project Objective and Approach
The main objective was to move away from subjective chart interpretation. Instead, we set out to build a machine-learning model capable of assessing a broad range of market factors and estimating the probability of an upward or downward price movement.
In practice, the challenge proved far more complex than writing a basic script based on a few technical indicators. Producing reliable forecasts required a complete, multi-stage data pipeline.
Raw data → Feature engineering → ML model ensemble → Forecast → Historical backtesting
Feature Engineering
The models were trained on a range of features designed to capture different aspects of market behaviour:
- Trend: Exponential and simple moving averages (EMA and SMA) were used to identify the broader direction of price movement.
- Volatility: Average True Range (ATR) helped measure current market volatility and filter out short-term noise.
- Overbought and oversold conditions: The Relative Strength Index (RSI) was used to identify potential market extremes.
- Price deviations: Bollinger Bands helped detect unusual movements away from the prevailing average.
- Support and resistance: Fibonacci levels were calculated automatically to identify potentially significant price zones.
- Price dynamics: Log returns were used to normalise price changes over time.
- Broader market factors: News sentiment and the performance of related market sectors were incorporated to provide additional context.
System Architecture: An LSTM-Based Model Ensemble
The models were trained on five years of detailed historical market data. Since conventional classification algorithms often struggle to capture relationships within time-series data, the core of the system was built as an ensemble of two models:
- Cross-sectional model: Analyses the current state of multiple market factors and identifies relationships between features at a given point in time.
- Temporal model (LSTM): Long Short-Term Memory networks are designed to process sequential data. This model tracks patterns in price movements and takes the asset’s recent behaviour into account when producing a forecast.
Validation, Backtesting and Results
To reduce the risk of overfitting, the system was evaluated using a strict validation process:
- Full historical backtesting on data that was not used during model training.
- Simulated trading with broker commissions and slippage included.
- Analysis of market anomalies and comparison of model forecasts with actual price movements.
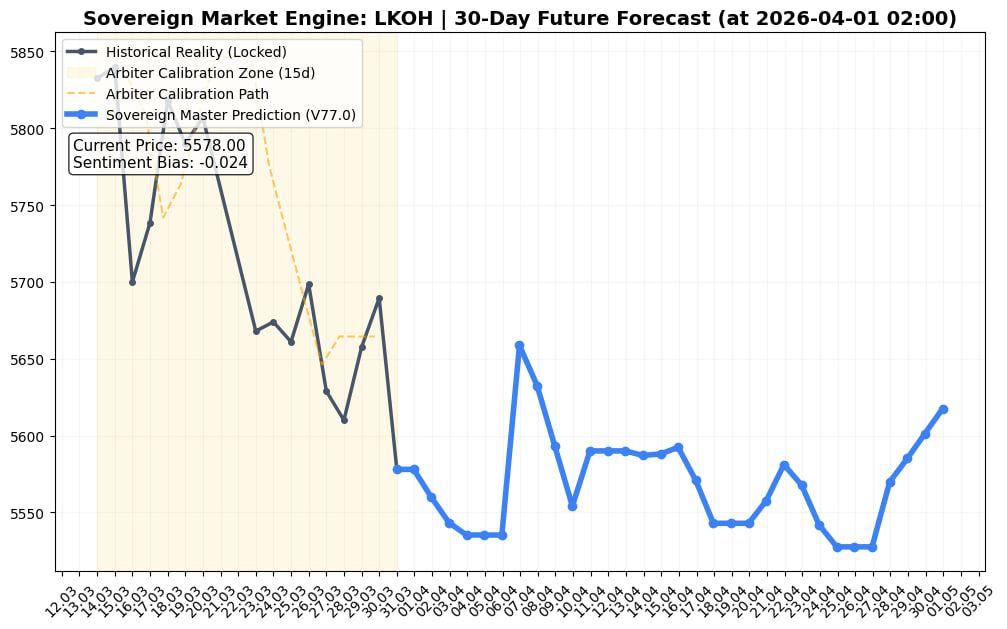
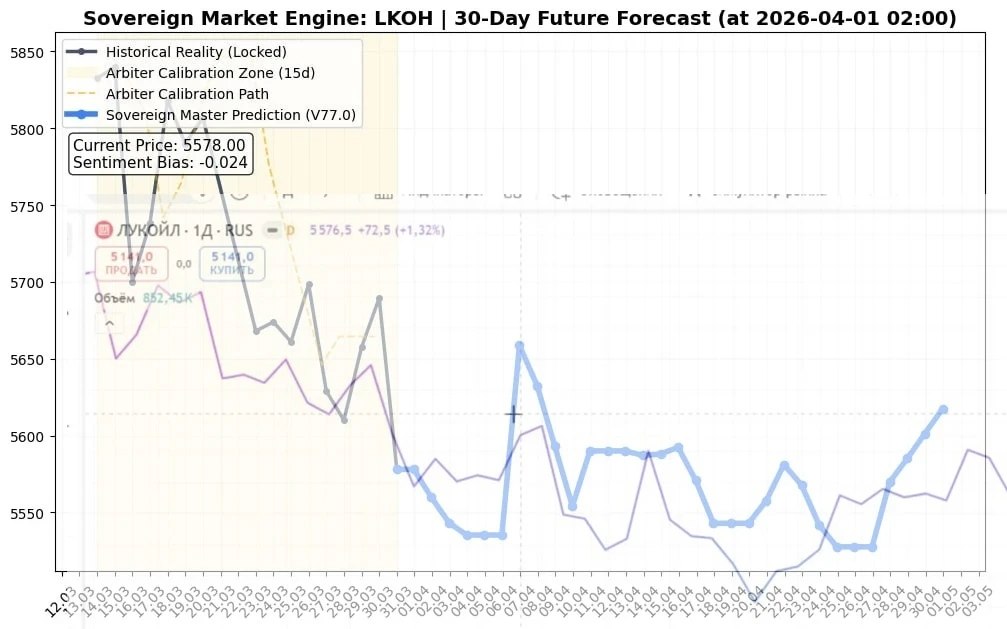
Chart: An example of the predictive model applied to historical data, comparing the forecast trajectory with the asset’s actual price movement.
Key Findings
This R&D project reflects the realities of developing modern artificial intelligence systems. Generative AI tools can assist with individual pieces of code or help optimise a specific function. Building the entire system, however—designing the data pipelines, configuring the validation process and integrating separate components into a stable working product—remains a demanding engineering task that requires solid software development experience.
The next stage of our research will focus on identifying the conditions in which the model performs most effectively, as well as examining the circumstances that lead to false signals.